
Think of digital marketing metrics as the vital signs for your marketing efforts. They are the specific, measurable numbers you track to see if your campaigns are actually working, helping you make smart decisions instead of just guessing.
Why Your Business Needs Digital Marketing Metrics
Imagine you’re the captain of a ship trying to reach a destination—that’s your business goal. Without a compass or a map, you’re just sailing blind. Digital marketing performance metrics are your navigation instruments. They give you the hard data needed to steer your campaigns, dodge icebergs, and make sure you actually get where you’re going.
This approach turns marketing from a fuzzy “creative” expense into a science driven by proof. It’s the very core of modern marketing strategies. When you can walk into a meeting and show a 25% jump in qualified leads or prove that every $1 you spent on ads brought back $5 in revenue, you’re speaking the language of business impact.
Distinguishing Actionable from Vanity Metrics
It’s easy to get caught up in numbers that look impressive on the surface but don’t actually move the needle. We call these vanity metrics. For example, hitting 10,000 followers on Instagram feels great, but if none of those people ever engage with your content, visit your website, or buy from you, that follower count is just an empty number.
Actionable metrics, on the other hand, are tied directly to your business goals. These are the numbers that tell you what to do next. For instance, knowing your “cost per lead from Facebook ads” is $15 is actionable. If your target is $10, you know you need to adjust your ad creative or targeting.
An actionable metric is one that ties specific and repeatable actions to observed results. The opposite of an actionable metric is a vanity metric (like web hits or number of downloads), which only serves to make you feel good. – Wikipedia on Lean Startup Methodologies
Getting this difference right is the first, most crucial step in measuring what really matters.
Laying the Foundation for Success
When you focus on the right metrics, you set your business up for real, sustainable growth. Here’s what tracking the right data empowers you to do:
- Make Smarter Decisions: Stop arguing about which ad copy is better. Practical Example: You’re running two Google Ads for a new product. Ad A has a Click-Through Rate (CTR) of 2% and a Conversion Rate of 1%. Ad B has a CTR of 1.5% but a Conversion Rate of 4%. The data clearly shows Ad B is more effective at driving sales, allowing you to confidently allocate your budget there.
- Secure and Justify Budgets: Nothing makes a stronger case for more marketing spend than showing a solid Return on Investment (ROI) or a low Cost Per Acquisition (CPA). Actionable Insight: Presenting a report that shows a 6:1 ROI on your content marketing efforts makes it much easier to ask for a larger budget next quarter.
- Optimize and Improve Continuously: Metrics reveal trends over time. If you see your email open rates slowly dipping, that’s a clear signal to start testing new subject lines or rethink your audience segmentation.
This guide will walk you through the essential metrics for every channel—from your website and SEO to social media and paid ads. By the time we’re done, you’ll have a clear roadmap for measuring the activities that truly drive your business forward.
Measuring Your Website and Traffic Performance
Think of your website as your digital storefront. The traffic? That’s the lifeblood. To really grow your online presence, you have to get a handle on who’s showing up, how they got there, and what they do once they’re inside. These metrics aren’t just abstract numbers on a dashboard; they tell the story of your customer’s journey.
Imagine your analytics platform is like a top-notch security camera system for your store. It shows you how many people walk in (Sessions), how many are window shopping for the first time (New Users), and which ones are loyal regulars (Returning Users). It even tells you how long they browse the aisles (Session Duration) and whether they walk right back out the door (Bounce Rate). Every piece of this data helps you build a better experience for them.
Key Traffic and Engagement Metrics to Watch
Going beyond just the total visitor count is where the real magic happens. The best insights come from digging into how different types of visitors behave on your site.
Sessions and Users: A Session is what we call a single visit to your site. Users, on the other hand, are the unique individuals behind those visits. One person can have multiple sessions, and knowing the difference helps you gauge both the size of your audience and how often they’re coming back for more.
New vs. Returning Users: A thriving website needs a healthy mix of both. Practical Example: If you see lots of new users but few returning ones, your content might be great for one-time answers but isn’t building a loyal community. This insight can prompt you to launch a newsletter to bring people back.
Average Session Duration: This one’s pretty straightforward—it’s the average amount of time people spend on your site during a visit. A longer duration is usually a great sign that your content is engaging, relevant, and keeping people interested enough to click around.
Bounce Rate: This is the percentage of people who land on a page and leave without clicking anywhere else. Context is everything here. Actionable Insight: A high bounce rate (e.g., 90%) on your homepage is a red flag signaling a potential design or messaging problem. But on a blog post that answers a specific question, a high bounce rate might mean the reader found exactly what they needed and left satisfied.
Where Is Your Traffic Coming From?
Knowing who is on your site is one thing, but knowing how they found you is just as crucial. Analyzing your traffic sources tells you which marketing channels are pulling their weight, so you can double down on what works and cut back on what doesn’t.
Tracking website traffic is a cornerstone of digital marketing performance. Businesses around the world are focused not just on the volume of visitors but where they originate—be it organic search, paid ads, or referrals. This helps them fine-tune their strategies, especially as privacy rules keep changing. You can find more great tips on tracking essential marketing metrics at TargetMarket.com.
Your most unhappy customers are your greatest source of learning. – Bill Gates
This quote from Bill Gates is surprisingly perfect for website analytics. A high exit rate on a key page or a dismal conversion rate from a specific traffic source is invaluable feedback, pointing you directly to what needs fixing.
The dashboard below, a typical view from Google Analytics, gives you a great visual on these key metrics.

This kind of snapshot lets you see user activity at a glance, showing trends in users, sessions, bounce rate, and session duration, giving you a quick pulse check on your site’s health.
Actionable Tips for Better Traffic Analysis
Just looking at the numbers isn’t enough. You have to use them to make smarter decisions. Here’s how to turn that data into real action:
Dig Into Traffic Source Performance: Jump into your analytics and see which channels (like Organic Search, Paid Search, Direct, or Referral) are bringing in the most engaged traffic. For example, if your organic visitors stick around for a long time but your paid traffic bounces instantly, you might need to rethink your ad targeting or the landing page you’re sending them to.
Use UTM Parameters for Campaigns: Want to know exactly how that email newsletter or specific social media ad is performing? Use UTM parameters. These are just simple tags you add to your URLs that tell your analytics tool precisely where a visitor came from, allowing you to get incredibly detailed with your campaign analysis. Practical Example: Use
utm_source=facebook&utm_medium=cpc&utm_campaign=summer_salein your ad’s URL to see exactly how many sales your “Summer Sale” Facebook campaign generated.Set Up Goals in Analytics: You need to define what a “win” looks like on your website. By setting up goals in Google Analytics, you can track key actions like a form submission, a file download, or a completed purchase. This is how you connect your website traffic directly to real business results.
Linking Marketing Metrics to Revenue and ROI
While seeing your website traffic climb is a great feeling, it doesn’t pay the bills. The real measure of your marketing’s success is its impact on the bottom line. This is where we shift from simply watching what users do to measuring how those actions generate actual business.
The metrics that truly matter—the ones your CEO and stakeholders care about—are those that tie your campaigns directly to revenue. When you get this right, marketing stops being seen as a cost center and starts being recognized for what it is: a powerful engine for growth.
Calculating Your Conversion Rate
Let’s start with a foundational metric: the Conversion Rate (CVR). In simple terms, this is the percentage of visitors who take the specific action you want them to. It’s the moment a passive browser becomes an active lead or customer.
That “action,” or conversion, could be anything: making a purchase, filling out a contact form, subscribing to a newsletter, or downloading an ebook.
The formula is straightforward:
Conversion Rate = (Number of Conversions / Total Number of Visitors) x 100
Practical Example: Imagine your e-commerce landing page gets 1,000 visitors this month, and 50 of them buy something. Your conversion rate is (50 / 1000) * 100 = 5%. Actionable Insight: If that number is low compared to industry benchmarks (say, 10%), it’s a clear signal to start A/B testing elements like your headlines, your call-to-action button color, or your page layout to see what improves performance.
The infographic below shows how various tools come together to feed you the data needed for these kinds of essential calculations.
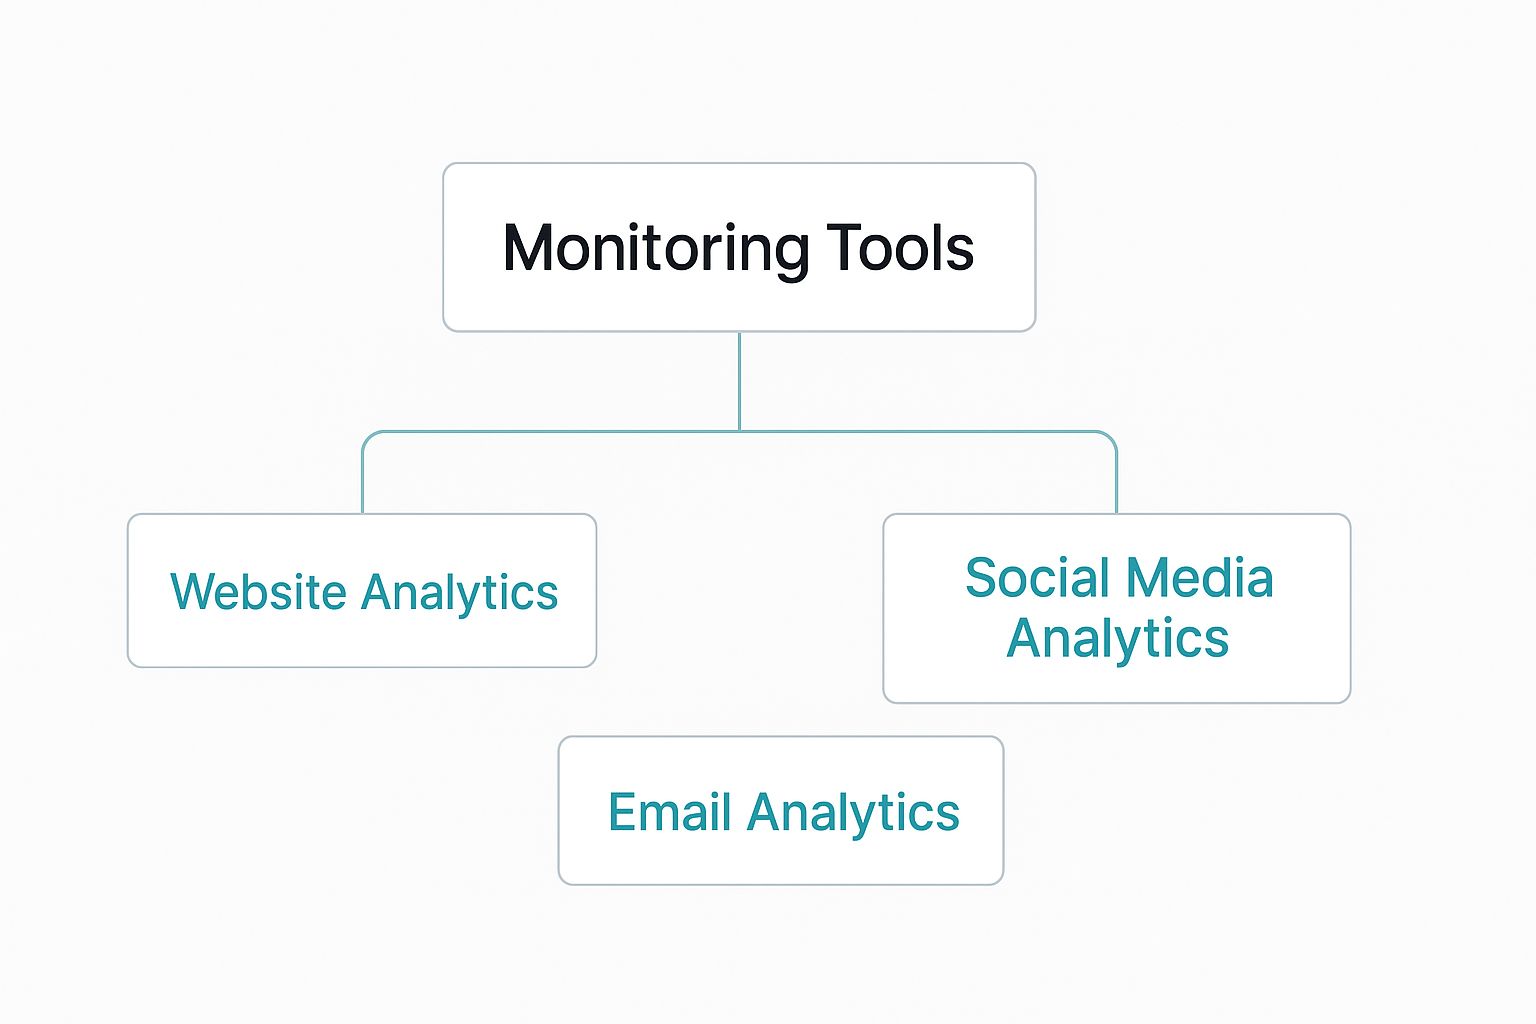
As you can see, getting a complete picture requires pulling data from your website analytics, social media platforms, and email marketing software.
Measuring Acquisition Costs and Advertising Returns
Getting conversions is great, but what did it cost you to get them? Answering this question is critical for profitability. This is where Cost Per Acquisition (CPA) and Return On Ad Spend (ROAS) enter the picture.
Cost Per Acquisition (CPA): This is your average cost to land one new customer through a specific campaign or channel. You calculate it by dividing your total marketing spend by the number of new customers you gained. A lower CPA means you’re acquiring customers more efficiently.
Return On Ad Spend (ROAS): This metric is all about your paid campaigns. ROAS tells you how much revenue you generated for every single dollar you spent on ads. The formula is Revenue from Ad Campaign / Cost of Ad Campaign. Practical Example: If you spend $500 on an Instagram campaign and it brings in $2,500 in sales, your ROAS is 5x (or 500%). You made $5 for every $1 spent.
Think of CPA and ROAS as two sides of the same financial coin. A low CPA and a high ROAS are the gold standard, proving your ad strategy is not just working but is also highly profitable. One of the best long-term strategies to improve these numbers is to lower your blended CPA by investing in an expert SEO service, which attracts high-intent customers organically without a direct ad cost per click.
Connecting Metrics to Long-Term Business Growth
Smart marketing doesn’t just focus on the next sale; it builds sustainable, long-term value. To measure this, we need to look beyond individual campaigns and focus on two bigger-picture metrics: Return On Investment (ROI) and Customer Lifetime Value (CLV).
Return On Investment (ROI) gives you the ultimate verdict on your marketing’s profitability. Unlike ROAS, which only looks at ad costs, ROI takes everything into account—software, salaries, creative, and ad spend. The formula is ((Net Profit – Marketing Cost) / Marketing Cost) x 100. A positive ROI is undeniable proof that your department is generating more value than it costs.
Customer Lifetime Value (CLV) completely re-frames how you think about customer acquisition. It shifts the focus from a single transaction to the total revenue you can expect from a customer over their entire relationship with your brand.
By understanding what a customer is worth over the long haul, you can justify spending more to acquire the right kind of customers—the ones who will stick around. CLV pushes you to invest in loyalty and retention, which is almost always more profitable than constantly chasing new leads.
To help you keep these critical metrics straight, here’s a quick reference table.
Key Revenue-Focused Metrics Explained
| Metric | Formula | What It Answers |
|---|---|---|
| Conversion Rate (CVR) | (Conversions / Visitors) x 100 | “How effective is my page at getting users to act?” |
| Cost Per Acquisition (CPA) | Total Marketing Cost / New Customers | “How much does it cost me to get one new customer?” |
| Return On Ad Spend (ROAS) | Revenue from Ads / Cost of Ads | “For every dollar I spend on ads, how many do I get back?” |
| Return On Investment (ROI) | ((Net Profit – Cost) / Cost) x 100 | “Is my overall marketing effort profitable?” |
| Customer Lifetime Value (CLV) | Avg. Purchase Value x Avg. Purchase Freq. x Avg. Customer Lifespan | “How much revenue is a single customer worth over time?” |
Ultimately, using ROI and CLV together gives you the strategic vision to not just run successful campaigns, but to build a truly resilient and profitable business.
How to Measure SEO and Content Marketing Success
SEO and content marketing aren’t about landing a few quick wins. Think of it as building a long-term asset, a digital engine that generates sustainable, organic growth for your business. To prove that engine is working, you need to track the right digital marketing performance metrics—the ones that connect your efforts directly to business results.

A good way to look at it is this: SEO is how you build your brand’s reputation with search engines like Google. The better that reputation, the more they’ll recommend you to their users. Content marketing is the substance behind that reputation—the valuable, trustworthy information you publish that earns you authority.
Essential SEO Performance Metrics
Keeping your SEO in good health means watching a few key indicators. These metrics don’t just tell you how you’re doing in search results; they show you where you can get more visible. They all work together to paint a full picture of your search presence.
- Organic Keyword Rankings: This is all about where your website shows up when someone searches for a specific term. Actionable Insight: Tracking your rank for a high-value keyword like “best running shoes for flat feet” shows progress. If you move from page 2 to the #3 spot, you can directly attribute the resulting traffic spike to your SEO efforts.
- Search Visibility: Think of this as your overall market share in search results. It’s a percentage that shows how often your site appears for a set of keywords you’re tracking.
- Backlink Quality and Quantity: Backlinks are links from other websites pointing to yours, and they act like votes of confidence. But it’s not a popularity contest based on numbers alone; quality is everything. One solid link from a respected, relevant site is worth more than a hundred from spammy, low-quality ones.
Local marketing is a massive piece of this puzzle. An incredible 97 billion local searches happen every single month, which lead to 1.5 billion visits to physical locations. And with searches including “near me” skyrocketing by 500% recently, you can’t afford to ignore local SEO.
Measuring Your Content’s Real Impact
When it comes to content, we have to look past simple page views. Sure, traffic is nice, but engagement is what really tells you if your content is hitting the mark and guiding people toward a business goal. A great piece of content should do a job, not just attract eyeballs.
“Content marketing is the only marketing left.” – Seth Godin
This quote perfectly captures a fundamental shift. Great marketing is no longer about interrupting people; it’s about providing genuine value. Your metrics should show exactly how much value your audience gets from what you create.
The right content metrics prove that your blog posts are more than just words—they’re powerful tools for generating leads and building your brand’s authority. A solid grasp of SEO content writing is the key to creating articles that both rank well and actually convert readers into customers.
Content Metrics That Drive Business Goals
To connect your content to real business outcomes, you have to focus on what users do. These data points show what your audience truly finds valuable and compelling.
- Time on Page and Scroll Depth: These two go hand-in-hand to measure engagement. If people are spending a lot of time on your page and scrolling most of the way down, it’s a clear sign your content is holding their attention.
- Click-Through Rate (CTR) from Search: You’ll find this in Google Search Console. It shows the percentage of people who saw your page in the search results and actually clicked on it. A high CTR means your title and meta description are doing their job and grabbing interest.
- Content-Driven Conversions: This is where the rubber meets the road. You need to track how many people download an ebook, sign up for a newsletter, or fill out a contact form after reading a specific blog post. Practical Example: By setting up goals in Google Analytics, you can see that your “Guide to Home Composting” blog post generated 75 new newsletter sign-ups last month, directly proving its value.
By keeping a close eye on these specific SEO and content metrics, you can clearly show how your organic channels are contributing to growth, building authority, and ultimately, driving revenue.
Gauging Your Social Media and Email Impact
Think of social media and email as your direct lines to your customers. While website and SEO metrics tell you how people find you, these channels show you how well you’re building relationships and sparking action.
But success here isn’t about bragging rights from a massive follower count or a huge subscriber list. The real story is in the engagement. The most important digital marketing performance metrics for social and email are all about interaction and influence—they tell you if your message is actually landing with the right people.
Key Metrics for Social Media Success
A giant follower count that doesn’t like, comment, or share is what we call a vanity metric. It looks good on paper but doesn’t mean much. To understand what’s really working, you need to look a little deeper.
- Engagement Rate: This is the pulse of your social media presence. It rolls up likes, comments, shares, and saves into one simple percentage that tells you how much your audience is actually interacting with what you post. A healthy engagement rate is a sure sign your content is hitting the mark.
- Audience Reach and Impressions: These two are often confused, but they tell different parts of the story. Impressions count every single time your content is displayed, while Reach tells you how many unique people saw it. You need both to understand your content’s true visibility.
- Referral Traffic: This is where the rubber meets the road. It shows how many people are clicking from your social profiles over to your website. Actionable Insight: If your Instagram referral traffic is high but has a high bounce rate, it means your social content is compelling, but the landing page isn’t meeting the expectations you’ve set.
Measuring social media impact means shifting from “How many followers do we have?” to “How many of our followers are actually listening and taking action?”
The numbers don’t lie. The global digital ad market is on track to hit $1.16 trillion by 2030, and social media is a massive piece of that pie. In 2023, 50% of consumers reported finding new products on social platforms, and 59% made purchases right there. You can discover more insights about digital marketing statistics on seoprofy.com to see just how powerful these channels have become.
Decoding Your Email Marketing Performance
Even with all the new platforms out there, email is still one of the most direct and powerful marketing tools you have. Unlike social media, where you’re at the mercy of an algorithm, an email lands straight in someone’s personal inbox.
Success in email marketing comes down to consistently delivering value. These core metrics will show you exactly how well your campaigns are performing, from the moment an email is sent to the moment a subscriber takes action. They highlight what’s working and, just as importantly, where you’re losing people.
Critical Email Metrics You Must Track
Open Rate: This is your first hurdle. It’s the percentage of people who actually opened your email. Your open rate is a direct reflection of two things: how recognizable your brand is and how compelling your subject line was. If it’s low, it’s time to start A/B testing your subject lines.
Click-Through Rate (CTR): Okay, they opened it. Now what? The CTR tells you what percentage of those openers went on to click a link inside your email. This is your prime indicator of how engaging your content, offers, and calls-to-action really are.
Conversion Rate: This is the bottom-line metric. Of all the people who received your email, what percentage clicked a link and completed the goal you set out for them—like buying a product, downloading a guide, or filling out a form? This is how you tie your email campaigns directly to revenue.
Unsubscribe Rate: It’s never fun to see people leave, but you need to watch this number. It’s the percentage of people who opt out after getting an email from you. A few unsubscribes are perfectly normal, but if you see a sudden spike, it’s a red flag that your content might be missing the mark or you’re sending emails too often.
By keeping a close eye on these social media and email metrics, you can stop guessing and start making data-backed decisions. This is how you fine-tune your strategy, build a genuinely connected audience, and prove the real-world value of your work.
Building Your Marketing Measurement Framework

Tracking random metrics is like collecting puzzle pieces without the box lid. You have all the parts, but you have no idea what the final picture is supposed to look like. A marketing measurement framework is your guide—it’s the structured approach that snaps all those pieces together, connecting what you do every day to what actually matters for the business.
This kind of framework forces a crucial shift in thinking. You stop just counting things and start asking what those numbers mean. Instead of just reporting a jump in website traffic, you start asking, “So what? What did that traffic actually do for us?”
From Metrics to Key Performance Indicators
The first step is to get clear on your Key Performance Indicators (KPIs). Think of it this way: a metric measures an activity (like page views or email opens), but a KPI is a very specific metric you hand-pick because it directly tracks your progress toward a critical business goal.
A Key Performance Indicator (KPI) is a measurable value that demonstrates how effectively a company is achieving key business objectives. Organizations use KPIs at multiple levels to evaluate their success at reaching targets. – Learn more about KPIs on Wikipedia
Your KPIs have to be tailored to your specific business. What’s critical for one company is just noise for another.
Practical Examples:
- An e-commerce store lives and dies by profitable sales. Their KPIs would be Conversion Rate, Average Order Value (AOV), and Customer Acquisition Cost (CAC). Their goal is to maximize AOV while minimizing CAC.
- A SaaS company, on the other hand, is all about the subscription game. Their primary KPIs will be Monthly Recurring Revenue (MRR), Customer Churn Rate, and Lead-to-Customer Rate. Their goal is to increase MRR and reduce churn.
Choosing the right KPIs makes sure your marketing team isn’t just busy; they’re busy working on the right things.
Creating Your Marketing Dashboard
Once you know what you’re measuring, you need one place to see it all. This is where a marketing dashboard comes in. It pulls all your most important digital marketing performance metrics into a single, visual command center.
And you don’t need to break the bank to get started. Honestly, a free tool like Google’s Looker Studio is more than powerful enough for most businesses. You just connect it to your data sources—Google Analytics, Google Ads, social media accounts—and you’ll have a real-time snapshot of your performance.
The trick is to make your dashboard tell a story. Don’t just dump every number you can find onto the screen. Actionable Insight: Organize your dashboard with top-level business results (like Revenue and Leads) at the top. Below that, show the channel-specific metrics (like organic traffic or email CTR) that are driving those results. This way, anyone can see at a glance what’s working and why.
Establishing a Reporting Rhythm
Data is worthless if it just sits there. A true measurement framework needs a regular reporting cadence to bring it to life. This rhythm ensures you’re not just collecting data but consistently using it to spot trends and make smarter decisions.
A tiered approach usually works best:
- Weekly Check-ins: A quick look at tactical metrics for active campaigns. Think ad spend, cost per acquisition (CPA), and other fast-moving numbers. This allows for rapid adjustments.
- Monthly Reviews: Zoom out a bit to analyze broader channel performance and see how you’re tracking toward your main KPIs (e.g., organic traffic growth, total marketing-qualified leads).
- Quarterly Strategy Sessions: This is the big picture view. You’re looking at long-term trends, overall ROI, and using that insight to guide your strategy for the next quarter.
With this structure in place, your metrics stop being a boring list of numbers. They become a powerful tool that proves marketing’s value and gives you the confidence to decide what to do next.
Your Top Questions About Marketing Metrics, Answered
Jumping into the world of digital marketing performance metrics can feel like learning a new language. Let’s clear up some of the most common questions so you can focus on measuring what really drives growth.
What’s the Difference Between a Metric and a KPI?
I like to think of it like this: metrics are all the players on a sports team, while KPIs are your star players—the ones you count on to win the game.
A metric is really any quantifiable data point you can track. Think website traffic, social media followers, or email open rates. A Key Performance Indicator (KPI), on the other hand, is a very specific metric you’ve singled out because it directly reflects your progress toward a crucial business goal.
Practical Example: Your total number of website visitors is a metric. But if your business goal is to generate more leads, a specific KPI would be “Number of qualified leads from organic traffic.” While all KPIs are technically metrics, only the ones most critical to your success earn the KPI title. If you want to dig deeper into the concept, the Wikipedia page on performance indicators is a good starting point.
How Often Should I Be Checking My Marketing Metrics?
There’s no one-size-fits-all answer here. The right rhythm for checking your metrics really depends on what you’re measuring and how quickly it changes. You wouldn’t check your retirement account balance every hour, and the same principle applies to your marketing data.
Daily or Weekly: This frequency is perfect for fast-moving metrics tied to active campaigns. Practical Example: When you launch a new Google Ads campaign, you should check its Cost Per Click (CPC) and Click-Through Rate (CTR) daily to make sure you’re not overspending on an underperforming ad.
Monthly or Quarterly: Save this cadence for your bigger-picture, strategic metrics. This is where you’ll see the long-term trends in things like organic traffic growth, Customer Lifetime Value (CLV), and overall brand reach. These metrics don’t change drastically day-to-day.
Which Metrics Matter Most for a B2B Company?
For B2B businesses, the sales journey is usually a marathon, not a sprint. Because the sales cycle is longer and involves more touchpoints, the most telling metrics are those connected to your sales pipeline and the quality of your leads.
Instead of getting fixated on immediate sales, it’s far more valuable to track:
- Marketing Qualified Leads (MQLs): Leads that fit your target profile and have engaged with your marketing.
- Sales Qualified Leads (SQLs): MQLs that the sales team has vetted and accepted.
- Lead-to-Customer Conversion Rate: The percentage of leads that become paying customers.
- Cost Per Lead (CPL): How much you spend on marketing to generate a single lead.
These specific digital marketing performance metrics give you a much clearer picture of your pipeline’s health and tell you just how well your lead generation machine is actually working.
Ready to stop guessing and start growing? At Galant Studios, we use data-driven strategies to make your website a powerful engine for attracting customers. Let’s build your online presence together. Visit us at https://galantstudios.com to learn how.