Your website is getting visitors, but what are they actually doing? To turn raw traffic numbers into real business growth, you need a plan. The entire process boils down to three core activities: setting clear business goals, installing a robust analytics tool like Google Analytics 4, and consistently tracking the metrics that matter. This is how you transform confusing data into a powerful tool for improving your site and growing your bottom line.
Get In Touch
Building Your Foundation for Smart Decisions
It’s dangerously easy to get lost in a sea of charts and numbers. Before you look at a single metric, ask yourself the most important question: “What am I trying to achieve?” Without a clear answer, you’re just hoarding data instead of gathering intelligence. Your business objectives are the compass for your entire analysis, ensuring every metric you track is tied to a tangible outcome.
This is all about connecting your business aspirations to what you can actually measure. Are you aiming to boost online sales by 15% this quarter? Generate 50 qualified leads per month? Or is your primary focus on building brand awareness in a new market? Each of these goals requires a different lens for viewing your traffic data.
Aligning Analytics with Your Business Goals
The real magic happens when you start to understand the people behind the numbers. Where are your visitors coming from? What do they do once they land on your site? And just as importantly, where do they give up and leave? The answers to these questions are your roadmap for making smarter decisions about everything from marketing campaigns to website design.
For a practical example, imagine you notice a flood of traffic from a new social media campaign, but none of those visitors sign up for your free trial. This could signal that your ad’s messaging is attracting the wrong crowd. Conversely, if you see a trickle of organic search traffic that converts at an incredibly high rate, that’s a clear sign you should double down on your SEO efforts. You’re moving from just looking at data to truly understanding what drives results.
The ultimate goal is to turn data from a simple scoreboard into a strategic playbook. Every data point should empower you to make a better decision tomorrow than you did today.
For most businesses, the go-to tool for this job is Google Analytics 4 (GA4). A clean, correct setup from the very beginning is absolutely critical if you want data you can trust.
This simple process shows how to get your analytics foundation right from the start.
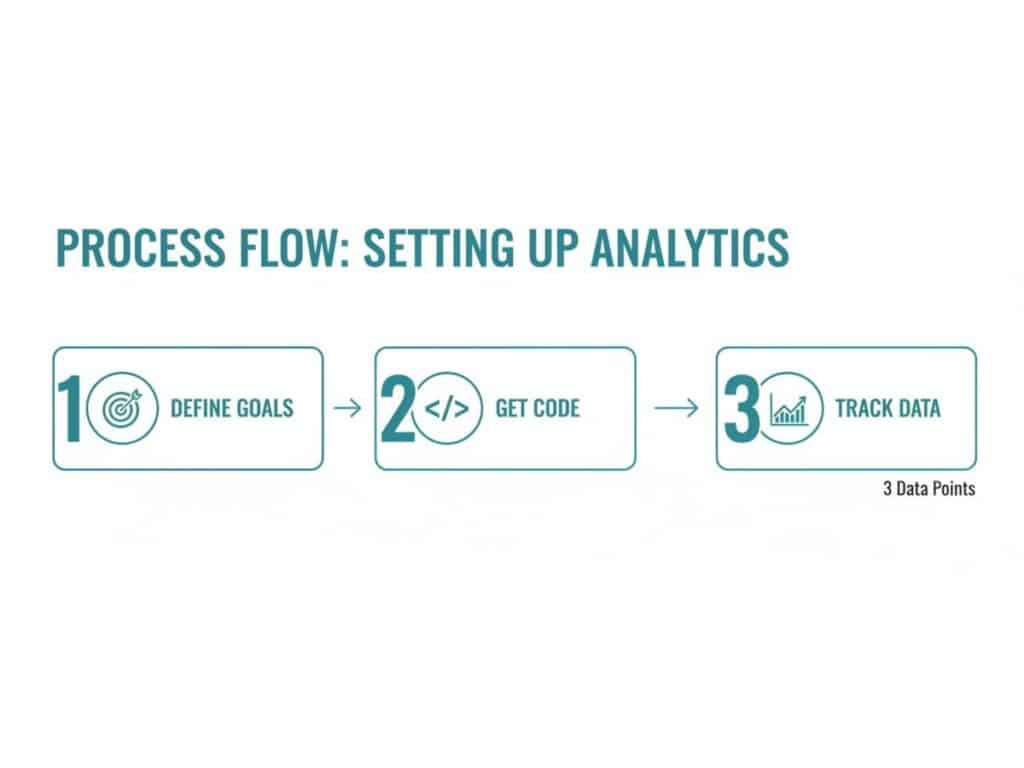
As you can see, a solid strategy (defining your goals) always comes before the technical work of implementation and tracking.
Getting Started with Google Analytics 4
Setting up GA4 correctly involves a few essential steps to ensure the data you collect is both accurate and genuinely useful.
- Create Your Account and Property: The first move is to create a Google Analytics account for your business, and within that, a “property” specifically for your website.
- Install the Tracking Code: You’ll then need to add a small piece of code—the GA4 tag—to every single page of your website. This is what allows Google to collect visitor data.
- Define Your Key Events: Finally, and most importantly, you’ll need to configure “conversion events.” These are the specific, valuable actions you want users to take, like submitting a contact form or completing a purchase. These are fundamental for measuring what actually matters. You can learn more about how these actions fit into a bigger picture by exploring key digital marketing performance metrics.
Understanding where your audience originates is vital, especially when you consider Google’s sheer scale. At its peak in November 2024, Google.com recorded 136 billion monthly visits. With organic search driving around 29% of all global traffic, a proper analytics setup is the only way to tap into that massive potential.
Get In Touch
Interpreting Your Primary Traffic Channels
Once the data starts rolling in, the real work begins. The next crucial step is figuring out where your visitors are coming from. Not all traffic is the same; each source tells a different story about your marketing, brand strength, and audience behavior. Getting this part right is the foundation for making smart decisions about where to put your time and money.
Think of your traffic channels as different doors to your business. Some people find you through a specific search, others are sent by a trusted source, and some just walk in because they already know your name. Each entrance brings in a different kind of visitor with different expectations.

When you start segmenting and analyzing these pathways, you graduate from just counting heads to understanding the quality and intent behind every visit. That’s where the real magic happens, allowing you to fine-tune your strategy for the best possible results.
Decoding Your Traffic Sources
Your analytics tool, whether it’s Google Analytics or something else, will break down your traffic into a few main channels. The names might differ slightly, but the core concepts are universal. Here’s what you’re looking at:
Organic Search: These are the people who find you through a search engine like Google or Bing. This traffic is a direct measure of your SEO health. High numbers here mean your content is resonating with what people are actively searching for.
Direct Traffic: This group includes visitors who type your URL straight into their browser or click a bookmark. It’s a fantastic indicator of brand recognition and loyalty—these are people who know you and are coming back for more.
Referral Traffic: When another website links to you and someone clicks it, that’s a referral. These visitors might come from partner blogs, news articles, or industry directories. Digging into this helps you spot valuable backlinks and potential collaboration opportunities.
Social Traffic: This is everyone who arrives from platforms like LinkedIn, X (formerly Twitter), or Facebook. It shows you how well your social media strategy is actually working to drive people to your site.
Paid Traffic: Any visitor who clicks on one of your ads—like Google Ads or a sponsored social post—falls into this bucket. This channel is all about measuring your return on investment (ROI) and making sure your ad budget is well spent.
To help you connect these channels to real business insights, I’ve put together a quick reference table.
Key Traffic Channels and What They Mean
| Traffic Channel | What It Represents | Key Metric to Watch | Actionable Insight Example |
|---|---|---|---|
| Organic Search | SEO performance & content relevance | Keyword rankings, conversion rate per landing page | A blog post ranks for a high-intent keyword but has a low conversion rate. Insight: Optimize the page’s CTA or content to better match user intent. |
| Direct | Brand awareness & customer loyalty | Returning visitor rate, pages per session | A high percentage of direct traffic suggests strong brand recall. Insight: Your brand-building efforts (like podcasts or events) are working. |
| Referral | Backlinks & partnership value | Conversion rate from top referring domains | A specific partner’s blog sends highly engaged traffic. Insight: Double down on that partnership with a co-hosted webinar or guest post. |
| Social | Social media engagement & campaign effectiveness | Bounce rate, time on page from social links | Traffic from LinkedIn has a low bounce rate, while X traffic bounces immediately. Insight: The content shared on LinkedIn is a better fit for the audience. |
| Paid | Ad campaign performance & ROI | Cost per acquisition (CPA), conversion rate | An ad campaign has a high click-through rate but a low conversion rate. Insight: The ad copy and landing page message are misaligned. |
This table provides a starting point for turning raw numbers into strategic questions about your marketing performance.
From Data to Strategic Action
The real value emerges when you start comparing these channels against each other. For instance, you might find that while social media brings in a lot of visitors, your organic search traffic has a 3x higher conversion rate. That’s a powerful insight. It tells you your SEO is attracting a more qualified audience ready to take action.
Likewise, a steady stream of direct traffic is a great sign of a healthy brand. In fact, direct traffic often accounts for 58% of all site visits, far outpacing organic search at 29%. If you’re a small business worried about low traffic, a small direct traffic number is a red flag that you need to focus more on brand awareness and local SEO. You can dive deeper into these website statistics to see how you stack up against industry benchmarks.
Your goal isn’t just to get more traffic; it’s to get the right traffic. By understanding which channels bring in the most engaged and highest-converting visitors, you can pour your resources into the sources that actually drive business growth.
Get In Touch
Analyzing On-Site User Behavior and Engagement
Getting people to your website is just the starting point. The real magic happens when you understand what they do once they arrive. To truly analyze your web traffic, you need to look past simple visitor counts and dig into their on-site behavior. This is where you’ll uncover how people are actually interacting with your content and, more importantly, where your user experience might be letting you down.
In Google Analytics 4, your first clues are metrics like Engagement Rate and Average Engagement Time. These give you a quick snapshot of user interest. Are people sticking around, scrolling, and clicking? Or are they taking one look and bouncing? A low engagement rate across your entire site often points to a major disconnect between what your visitors expected and what they found.

Identifying Popular Pages and Exit Points
To get insights you can actually use, you have to get granular and look at individual page performance. A great place to start is with your most popular pages. Think of these as your greatest hits—the content that’s clearly hitting the mark with your audience. Ask yourself what makes them work so well. Is it the topic? The format? Or maybe a crystal-clear call-to-action?
On the flip side, you need to spend just as much time looking at pages with a high Exit Rate. These are the dead ends where you’re losing people. Now, not all exits are bad. A high exit rate on a “thank you” page after a purchase is perfectly normal.
However, when a key service or product page has a high exit rate, it signals a problem. This friction point could be anything from confusing navigation to a broken link, and it directly impacts your ability to convert traffic into customers.
If you spot an unusually high exit or bounce rate on a page that should be pushing visitors deeper into your site, it’s a red flag. Our guide offers some practical steps on how to improve bounce rate by tackling these common user experience roadblocks.
Segmenting Behavior by Device Type
It’s also crucial to segment your data by device. Someone browsing on a large desktop monitor behaves completely differently than someone on a smartphone. This isn’t a small detail; with mobile traffic now accounting for over 64% of all web traffic globally, a clunky mobile experience can be a conversion killer. In fact, just a two-second delay in mobile page load time can increase bounce rates by a staggering 87%. You can find more data on this trend in recent mobile website traffic research.
By filtering your behavior reports by device, you can spot problems that might otherwise go unnoticed. You might discover a landing page that converts beautifully on desktop but has a dismal conversion rate on mobile. This kind of insight allows you to zero in on specific mobile usability issues—like a form that’s impossible to fill out on a small screen—and make targeted fixes that improve performance for everyone.
Get In Touch
Translating Data Into an Actionable Growth Plan
All the analytics reports in the world are just noise until you connect the numbers to a real-world purpose. The true value of digging into your website traffic comes when you start translating those data points into a concrete plan for growing your business.
This is the part where you shift from just watching the numbers to actively improving your website and marketing. The whole process really boils down to asking two simple questions: “Why?” and “So what?” Why are certain groups of visitors converting better than others? So what if a specific page has a high exit rate? Answering these turns abstract metrics into tangible opportunities.
Find Your Best Customers by Segmenting Your Audience
It’s a simple truth: not every visitor is created equal. Some are just browsing, while others are ready to buy. Audience segmentation is how you sort these visitors into groups based on shared traits, helping you understand which ones are most valuable to your business. This lets you put your time and money where they’ll have the biggest impact.
Your analytics tool gives you plenty of ways to slice up your audience data:
- Geographic Location: Compare conversion rates from different countries, states, or even cities. A local plumber might discover that 95% of their qualified leads come from a single metropolitan area. That’s a powerful reason to double down on local ad campaigns right there.
- Device Type: Look at how people on mobile devices behave compared to those on desktops. If you’re getting tons of mobile traffic but hardly any mobile sales, you’ve just found a major red flag. It’s a clear signal to dive into your mobile checkout process and figure out what’s broken.
- Marketing Campaign: Use UTM parameters to track every click from your marketing efforts. This shows you precisely which email newsletter, social ad, or influencer post is driving not just traffic, but actual revenue.
When you isolate these groups, you start to paint a clear picture of your ideal customer. You learn who they are, where they come from, and how to tailor your message to attract more of them.
The goal of segmentation is pretty straightforward: figure out who your best customers are, learn how they found you, and then go find more people just like them.
Analyze Your Conversion Funnel to Unplug the Leaks
A conversion funnel is just a map of the steps a visitor takes to complete a goal on your site, like making a purchase or signing up. Breaking down this journey is one of the best ways to find the hidden points of friction that are quietly costing you money. The goal is to pinpoint exactly where people are giving up and dropping out.
Let’s take a classic e-commerce example. Imagine a store has a four-step checkout: Cart > Shipping Info > Billing Info > Confirmation.
After looking at the funnel data, the owner sees something alarming. While 90% of people who add an item to their cart make it to the shipping page, only 20% of those users ever get to the billing step. That’s a massive 70% drop-off at a single stage. This isn’t just a number; it’s a critical clue pointing to a big problem.
What could be happening? Maybe the shipping costs are a nasty surprise. Perhaps the address form is clunky and confusing. This data gives you a specific place to start digging. You can form a clear hypothesis—”Users are abandoning their carts because of unexpected shipping fees”—and then test a solution, like offering free shipping or showing the costs much earlier in the process.
To help you get into this mindset, here’s a framework for turning common analytics findings into decisive action.
From Data Point to Business Action
This table helps translate what your data is telling you into what you should do next.
| Common Finding | Potential Problem | Actionable Next Step |
|---|---|---|
| High traffic to a blog post, but low conversions. | The content is attracting an informational audience, not a transactional one. | Add a stronger, more relevant call-to-action (CTA) or offer a content upgrade like a downloadable guide to capture leads. |
| Low session duration from a specific social media channel. | The ad copy is creating expectations that the landing page doesn’t meet. | Make sure the landing page headline, images, and offer perfectly match the ad creative for a seamless experience. |
| High cart abandonment at the payment step. | Shoppers have security concerns or don’t see their preferred payment method. | Add trust seals (like SSL certificates) and integrate popular payment gateways like PayPal or Apple Pay. |
This methodical approach of segmenting your audience and analyzing your funnels is what turns web traffic analysis from a chore into a powerful engine for business growth.
Get In Touch
Going Beyond Standard Analytics with Advanced Tools and Reporting
Standard analytics tells you what is happening on your site, but to really understand the why, you need to dig deeper with more sophisticated tools. When you move past basic metrics, you start to see your website through your visitors’ eyes. This is where you uncover the subtle friction points and missed opportunities that data tables alone just can’t show you.
This is where visual behavior tools, like heatmaps and session recordings, become incredibly useful. Instead of just seeing that a page has a high exit rate, you can literally watch recordings of user sessions to pinpoint exactly where they get stuck or confused. Heatmaps roll all that data up visually, showing you where people are clicking, how far they’re scrolling, and what parts of your page they ignore completely.

This kind of qualitative data adds essential context. For instance, a heatmap might show that dozens of visitors are trying to click on an image that isn’t actually a link—a clear signal that your design is causing confusion.
Tearing Down Data Silos for a Complete Picture
To get a truly complete view of your performance, you can’t have your data living in separate, disconnected buckets. Integrating Google Analytics with your other platforms is one of the most important things you can do to build a holistic understanding of your traffic.
Connecting Google Analytics with Google Search Console is a game-changer. This simple integration pipes your search query data directly into your GA4 reports. Suddenly, you can see the exact search terms people used to find your pages, along with click-through rates (CTR), average keyword positions, and impressions. It creates a direct line of sight between your SEO work and what people do once they land on your site. We dive much deeper into this connection in our guide on how to track SEO performance.
By combining “what users do on your site” (from Analytics) with “how they find you in search” (from Search Console), you can make smarter content and optimization decisions.
Let’s say you find a page that ranks well for a target keyword but has a depressingly low CTR from search results. This is a huge red flag that your page title or meta description isn’t grabbing attention, giving you a clear, actionable task to improve it.
Building Custom Reports That Drive Action
The final piece of the puzzle is building custom dashboards and automated reports that filter out the noise. Standard reports are a good starting point, but they’re often full of vanity metrics that can distract you from what actually moves the needle for your business.
Your custom reports should be built around your specific Key Performance Indicators (KPIs). If you’re running an e-commerce store, a good dashboard might focus on just a few critical metrics:
- Conversion Rate by Traffic Source: Instantly see which channels are making you money.
- Average Order Value: Keep an eye on customer spending habits over time.
- Cart Abandonment Rate: Monitor friction points in your checkout process.
If you’re selling on major retail platforms, you’ll need specialized tools to get the full story. For instance, Amazon Brand Analytics offers indispensable data on how shoppers discover, compare, and ultimately buy products.
By automating these focused reports, you ensure that you and your team are always looking at the numbers that matter most, making it far easier to track progress, communicate results, and make a solid case for your strategic decisions.
Get In Touch
Common Questions About Analyzing Web Traffic
Even with the best tools at your fingertips, digging into web traffic data can feel overwhelming and often raises more questions than it answers. Here are some of the most common hurdles I see business owners and marketers face, along with some straightforward advice to clear them up.
How Often Should I Actually Check My Analytics?
There’s no magic number here—the right frequency really depends on your business and what you’re trying to achieve.
For most businesses, a quick weekly check-in is the sweet spot. This is frequent enough to catch any major shifts or sudden drops in performance before they become big problems, but not so often that you get bogged down by meaningless daily fluctuations.
When it’s time to think about the bigger picture, a monthly deep dive is far more useful. With a full month of data, you can see how you’re tracking against your long-term goals and make smarter strategic decisions. The exception? If you’ve just launched a big ad campaign or a new product, you’ll want to be in there daily to make sure your budget is being spent effectively and to make quick adjustments.
The most important thing is to be consistent. Pick a schedule and stick to it. Regular, focused analysis is infinitely more valuable than a massive, chaotic data dive every six months. It builds a proactive habit, not a reactive headache.
Why Do I Have Tons of Traffic but No Sales?
This is probably the most frustrating question in web analytics, and the answer almost always comes down to a disconnect between who is visiting your site and what they find when they get there.
Your first move should be to get forensic about your traffic sources. Where are all these people coming from? Are your top channels actually delivering visitors who are ready to buy, or are they just bringing in casual browsers looking for information?
Once you’ve looked at the who, you need to look at the what. Dig into your on-site behavior:
- What are the engagement rates on your key landing pages? Are people sticking around or bouncing immediately?
- Where are people abandoning your conversion funnel? Pinpoint the exact pages where they’re dropping off.
- Use tools like heatmaps to see your site through your users’ eyes. Are your main calls-to-action getting lost? Is the layout confusing?
Working through these steps will tell you if you have a traffic problem (attracting the wrong people) or a website problem (failing to guide the right people).
What’s a “Good” Conversion Rate, Anyway?
Everyone wants to know the magic number, but the truth is, a single “good” conversion rate doesn’t exist. It varies wildly depending on your industry, your traffic quality, and what you’re even counting as a conversion.
For instance, the U.S. Small Business Administration notes that a small e-commerce site might celebrate a 1.5% conversion rate, while a B2B company could easily hit 5% on a lead-generation form. They’re completely different goals for completely different audiences.
Instead of chasing some generic industry benchmark, focus on your own. Establish your baseline, and then work tirelessly to improve it. The goal is steady, incremental growth against your own historical performance. Slice your data by segments—like new vs. returning visitors or mobile vs. desktop—to find where your biggest opportunities are hiding. That’s far more productive than comparing yourself to an irrelevant average.
Ready to turn your website traffic into measurable growth? At Galant Studios, we specialize in data-driven SEO and website optimization to help your business attract the right audience and convert them into loyal customers. Let us build a strategy that delivers real results. Learn more about our approach at https://galantstudios.com.